Over the past 15 months, the Federal Open Market Committee (FOMC) has quickly tightened the stance of monetary policy by raising the target federal funds rate 500 basis points and reducing its portfolio of securities by more than $700 billion. These actions aim to slow demand for goods and services, better balance labor market supply and demand, and reduce inflation, which has been running well above the FOMC’s longer-run target of 2 percent.
Recent stress in financial markets may seemingly aid the FOMC’s efforts. In early March, financial markets expected significant further increases in the federal funds rate against a backdrop of ongoing inflationary momentum. Market-implied expectations for the federal funds rate then fell markedly following the failures of Silicon Valley Bank and Signature Bank. Chart 1 shows that the Kansas City Fed’s Financial Stress Index (KCFSI) spiked in March 2023 following these bank failures, as fears of an impending credit crunch swelled._
Chart 1: Financial stress spiked in March 2023 after bank failures
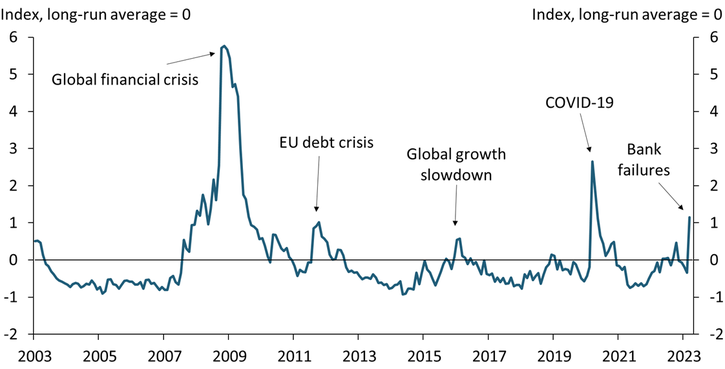
Note: A positive value indicates that financial stress is above its long-run average, while a negative value indicates financial stress is below its long-run average.
Source: Federal Reserve Bank of Kansas City (Haver Analytics).
A spike in the KCFSI historically leads to higher unemployment and somewhat lower inflation._ The left panel of Chart 2 shows that a one standard deviation increase in financial stress (green line) typically portends an increase in the unemployment rate of 0.7 percentage points. The right panel shows that financial stress historically reduces inflation as well: inflation, as measured by the consumer price index (CPI), falls by about 0.4 percentage points in the first year following an increase in financial stress (green line).
Chart 2: Increases in financial stress have historically weighed on activity, less on inflation
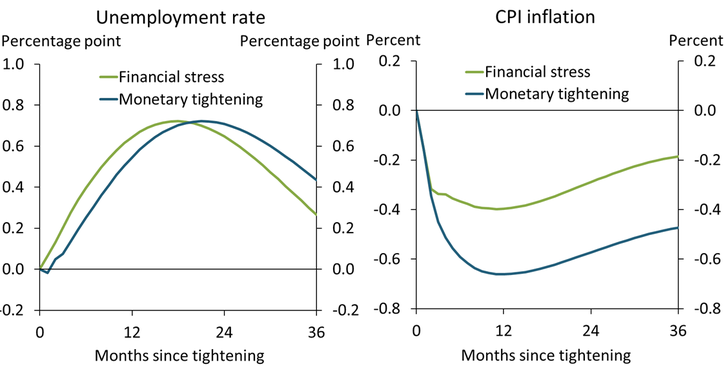
Notes: These charts show the effect of a financial stress or monetary tightening shock on the time path of each variable relative to the time path absent a shock. To compare their disinflationary effects, the two shocks are scaled to generate the same increase in the unemployment rate.
Sources: U.S. Bureau of Labor Statistics (BLS) and the Federal Reserve Bank of Kansas City (both accessed via Haver Analytics); Bundick and Smith (2020).
Could the recent increase in financial stress generate the same disinflationary effects as tighter monetary policy? The left panel in Chart 2 shows that monetary policy tightening, as measured by an unexpected increase in the expected path of the federal funds rate (blue line), slows economic activity and raises the unemployment rate, similar to an increase in financial stress._ However, despite a similar increase in the unemployment rate, inflation falls by 0.65 percentage points in the first year following monetary tightening (right panel), a considerably larger decline than we estimate following an increase in financial stress. To summarize this comparison, Chart 3 shows the cumulative change in inflation over three years for a one percentage point increase in the unemployment rate for each shock (left panel)._ By this metric, financial stress is about half as disinflationary as monetary tightening.
Chart 3: Financial stress reduces inflation less than monetary policy tightening
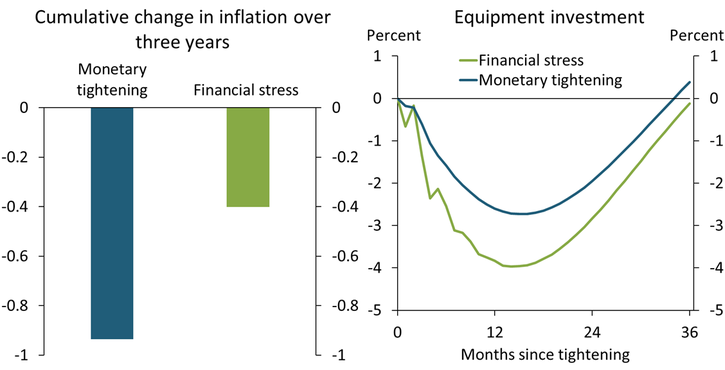
Notes: The left panel shows the cumulative change in inflation for a 1 percentage point increase in the unemployment rate. The right panel shows the effects of each shock on investment relative to the time path absent a shock. Again, each shock is scaled to generate the same increase in the unemployment rate.
Sources: BLS and the Federal Reserve Bank of Kansas City (both accessed via Haver Analytics), and Bundick and Smith (2020).
Why does financial stress reduce inflation less than monetary policy tightening? Empirical evidence suggests that heightened financial stress may adversely affect both supply and demand in the economy, thereby dampening its disinflationary effects. The right panel of Chart 3 shows that for the same increase in the unemployment rate, investment in capital equipment falls considerably more following an unexpected increase in financial stress (green line) than following unexpected monetary policy tightening (blue line). The persistently lower path of investment spending following a financial stress episode could adversely affect the economy’s future productive capacity.
Even if recent stresses were to morph into a much more severe financial crisis, historical evidence cautions against expecting large reductions in inflation. Chart 4 shows complementary analysis from an international database that tracks systemic financial crises across 17 advanced economies since World War II. Systemic financial crises from this historical sample show an even more muted disinflationary effect—with inflation actually rising (blue line)—despite the unemployment rate increasing as much as 4 percentage points (green line). Similar to the pattern in Chart 3, the muted response of inflation is accompanied by large declines in investment (orange line), further suggesting that financial crises can exhibit adverse supply dynamics, thereby dampening, or even reversing, their disinflationary effects._
Chart 4: Even systemic financial crises have historically shown little effect on inflation
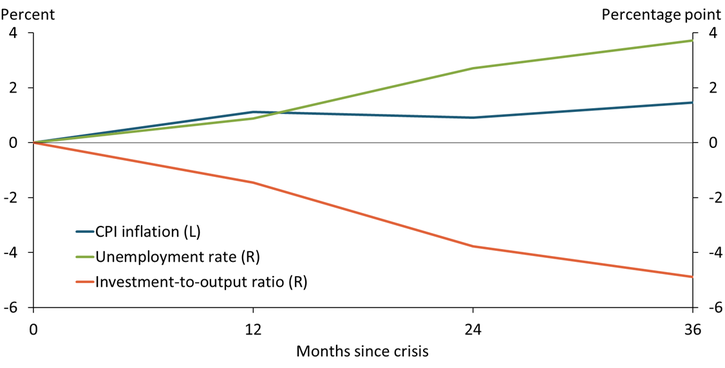
Note: The chart shows the cumulative average effect of a post-World War II systemic financial crisis across 17 advanced economies for each variable relative to the time path absent the crisis.
Sources: Jordà, Schularick, and Taylor (2017) and authors’ calculations.
Even though both financial stress and monetary policy tightening slow economic activity, they do not necessarily have the same implications for inflation. Our analysis shows that financial stress generates more modest disinflationary effects than monetary policy tightening for the same increase in the unemployment rate. Therefore, to the extent financial stresses reduce inflation, they do so at a higher cost of unemployment, making them a less-than-ideal substitute for tighter monetary policy.
Endnotes
-
1
Current and archived releases of the External LinkKCFSI are available on the Kansas City Fed’s website. The KCFSI is a monthly measure of stress in the U.S. financial system based on 11 market variables. When aggregated to a quarterly frequency, the KCFSI correlates highly with the net share of banks tightening credit to small firms as measured in the Senior Loan Officer Opinion Survey (SLOOS). The SLOOS for 2023:Q1 was released May 8.
-
2
We estimate the effects of an unexpected increase in the KCFSI using a structural vector autoregression (SVAR) consisting of the following variables: the unemployment rate, real equipment investment measured by core capital goods orders deflated by the PPI for capital equipment, capacity utilization, the CPI, interest rate expectation surprises, the KCFSI, and the two-year Treasury yield. The SVAR model is closely related to the one used in Bundick and Smith (2020). Our identifying assumption for modeling the effects of a KCFSI shock is that while slow-moving variables (the unemployment rate, real equipment investment, capacity utilization, and the CPI) cannot respond within the same month to a change in the KCFSI, fast-moving financial variables (the two-year Treasury yield) can. Hakkio and Keeton (2009) and Gilchrist and Zakrajšek (2012) make similar assumptions to identify financial shocks. We also assume that an unexpected shock to the KCFSI is orthogonal to our monetary policy shock. Equipment investment and the CPI enter the SVAR in the form of 100 times the natural log. We estimate the model from 1994 to 2015 using three lags, following Bundick and Smith (2020).
-
3
Our measure of monetary policy shocks is from Bundick and Smith (2020), and our model is closely related to the one used in that paper. See endnote 2 for a full description our modified model.
-
4
This calculation is motivated by the Phillips Multiplier calculation as described in Barnichon and Mesters (2021), implied by the ratio of the impulse response for log CPI prices and the cumulative response of the unemployment rate from our SVAR, averaged over one to three years.
-
5
Financial crises are narratively identified. We search for the nearest business cycle peak around a financial crisis. We then estimate Recession Local Projections to trace out the average recession path over the first three years following each peak associated with a financial crisis, similar to the methodology in Matschke and Nie (2022). We subsequently subtract a pre-crisis trend from the estimated path.
References
Barnichon, Regis, and Geert Mesters. 2021. “External LinkThe Phillips Multiplier.” Journal of Monetary Economics, vol. 117, pp. 689–705.
Bundick, Brent, and A. Lee Smith. 2020. “External LinkThe Dynamic Effects of Forward Guidance Shocks.” Review of Economics and Statistics, vol. 102, no. 5, pp. 946–965.
Gilchrist, Simon, and Egon Zakrajšek. 2012. “External LinkCredit Spreads and Business Cycle Fluctuations.” American Economic Review, vol. 102, no. 4, pp. 1692–1720.
Hakkio, Craig S., and William R. Keeton. 2009. “Financial Stress: What Is It, How Can It Be Measured, and Why Does It Matter.” Federal Reserve Bank of Kansas City, Economic Review, vol. 94, no. 2, pp. 5–50.
Jordà, Òscar, Moritz Schularick, and Alan M. Taylor. 2017. “External LinkMacrofinancial History and the New Business Cycle Facts,” in Martin Eichenbaum and Jonathan A. Parker, eds., NBER Macroeconomics Annual 2016, vol. 31. Chicago: University of Chicago Press.
Matschke, Johannes, and Jun Nie. 2022. “External LinkDownward Wage Rigidities and Recession Dynamics in Advanced and Emerging Economies.” Federal Reserve Bank of Kansas City, Research Working Paper no. 22-10, August.
Brent Bundick is a senior research and policy advisor, Johannes Matschke is an economist, and A. Lee Smith is a senior vice president and economist at the Federal Reserve Bank of Kansas City. The views expressed are those of the authors and do not necessarily reflect the positions of the Federal Reserve Bank of Kansas City or the Federal Reserve System.